
It’s probably fitting that the data revolution in sports didn’t begin in a team’s front office but in two of the most American of industries: pharmaceuticals and defense.
It sparked in the bored minds of a pair or remarkable men you likely haven’t heard of, who turned analytics from a set of loose ideas into something rigorous in the '60s and ‘70s. One was a pharmaceuticals researcher, the other an engineer working a radar system that monitored Soviet missile launches. Both had access to computers, and the time and zeal to put them to use, long before the general public did. The work itself concerned them more than the glory, which is just as well since there wasn’t any coming. Solving baseball’s enduring puzzles, to those who could even see them, was its own reward. They changed everything but were never given their due.
But before we get to them, we have to talk about how much F.C. Lane needed his readers to know that the batting average was a flawed statistic.
In a series of long and outraged articles in Baseball Magazine, the first of which appeared in 1916, Lane pointed out the flaws in baseball’s central hitting stat. Lane, who edited Baseball Magazine for 26 years before turning to a prolific career writing books about nature, laid out his case. He used a great many words to argue that treating every kind of hit the same was about as precise as counting each bill or coin in a man’s wallet as a single unit of wealth, no matter the denomination.
Baseball owed this statistical atrocity to Henry Chadwick and his box score. Chadwick emigrated from England to the United States in 1837. He was 12, and brought with him a fondness for cricket and moralizing. He became a cricket journalist for several New York newspapers and magazines before he took an interest in baseball. Chadwick assigned himself the task of imposing statistical order upon the new sport, to lend it the same heft as the gentleman’s game of his youth, in the form of the box score. In the process, he grew somewhat controversial, but also so influential that he earned the nickname “Father Baseball.”
Eager to convey the seriousness befitting a fully-fledged sport, baseball quickly embraced Chadwick’s numbers, initiating its long and ongoing love affair with statistics. Early box scores essentially replicated cricket’s, reflecting only runs and outs for every batter. At one point, Chadwick had made up a box score with nine categories for every batter, describing his day at the plate in great detail. For reasons known only to him, he abandoned it, saddling baseball with an inexact set of metrics instead.
The box score Chadwick ended up with noted only a batter’s hits and runs, and reflected his bizarre ideas about baseball as a vehicle for promoting virtue. He advocated fining players for profanity, arguing with umpires, or even questioning decisions by their team captain. He saw the base hit, a statistic he had invented himself, as “the one criterion of the skill at the bat” and thought home runs inferior for being “the easiest hit.” He also believed walks were failures by the pitcher and no credit to the hitter; conversely, he thought strikeouts were the fault of hitters and little to do with pitchers, whose efforts to throw the ball as hard as they could he frowned upon as needlessly dangerous.
This fundamental misunderstanding of what actually produced runs, and therefore won games, led Chadwick to create the statistic that best-satisfied his fetish for singles and downplayed almost every other achievement: batting average.
All of which is to say that Lane had a good case. He was ignored, though, and so were the other early proponents of baseball analytics. Legendary executive Branch Rickey employed a Canadian statistician who hated math, Allan Roth. In 1954, Rickey published an article in Life magazine taking credit for Roth’s research, including a formula for a team’s scoring efficiency and several new offensive statistics, by predicting that “baseball people—and that includes myself—are slow to change and accept new ideas. [...] But they will accept this new interpretation of baseball statistics eventually. They are bound to.”
Other iconoclasts came and went, writing papers and self-published books of varying merit on arcane statistical baseball research that few understood and fewer still cared about. In 1969, Pete Palmer discovered a paper by one such analytics pioneer in the stacks at MIT. That’s where the birth of the analytics movement really began.
The similarities between Pete Palmer and Dick Cramer are uncanny.
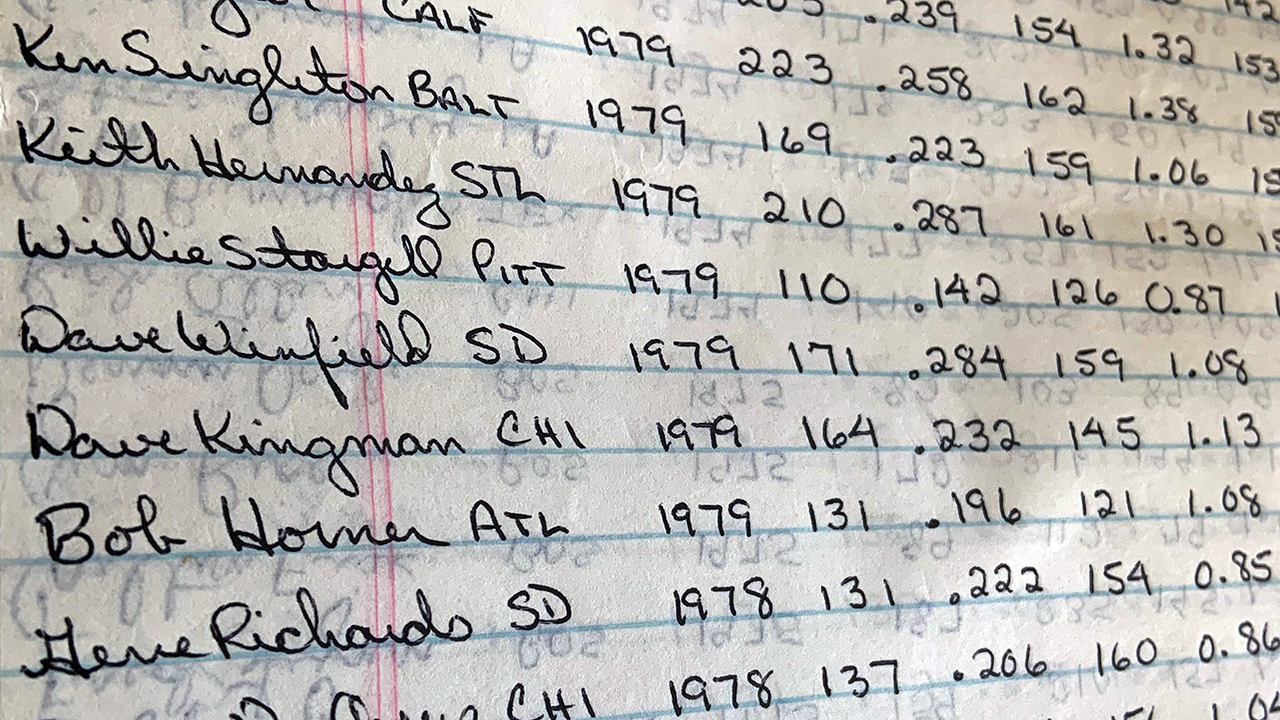
Palmer had been besotted by baseball since he was 9 and a serious baseball card collector from age 10, but never much of an athlete. The numbers in baseball spoke to him, and obeyed him in a way that the game itself never did. Like a junkball pitcher, he could make the numbers do as he commanded. Using paper and pencil, Palmer made lists of things. Every major leaguer who scored 100 runs in a season, or batted in 100, or got 200 hits. Then he began arranging all that information into tables and used a slide rule to calculate things. This was the shape his fandom took.
An uncommonly intelligent child, Palmer sailed through an expensive private school and Yale, where he earned a degree in electrical engineering while learning little that he didn’t already know. He went to work for the defense contractor Raytheon before joining MITRE—an offshoot of MIT that conducts research for various government agencies—in 1969. This gave him access to an extensive research library, and it was there that he found some early work by a man named Harold Hollis on scoring and win probability in baseball. It happened to align with Palmer’s own theories on the game.
Working at MITRE gave Palmer access to a computer, a rare and priceless thing at that time. Palmer wanted to test out Hollis’s formula, and set about computerizing his database of Major League statistics by working his way back from that year. Each player required a separate punch card that could be fed into the room-sized IBM mainframe computer. It took a few hundred cards to create the data for the 1969 season. “I said, ‘Gee, that didn’t take too long,’” Palmer told me. “So I thought I’d keep working on it.” He went all the way back to 1871. That probably gave him the nation’s most comprehensive statistical record of baseball’s history. Collecting it all had been an ordeal; complete stats were often hard to find and error-prone.
This took Palmer nearly two decades, during most of which he was the official statistician for the American League, on the stat crew of the New England Patriots, and building a basketball database as well. By the end, Palmer had punched out more than 100,000 cards. Then the floppy disk was invented and he threw all those punch cards, which filled 30 filing cabinet drawers, in the trash.
When Palmer started his research in earnest, all anybody knew for sure was that you won a game of baseball if you scored more runs than the other team. But Palmer worked out that, over the course of a season, a team’s total wins could be predicted by taking its total runs and dividing them by 10, with a standard deviation of three wins. From there, he worked back to win shares, deconstructing how likely every possible scenario on offense was, on average, to contribute to a run—and, therefore, a share of a potential win. Palmer would call his system “Linear Weights.” It changed the way that people understand baseball.
Palmer had written an article for The Sporting News that anointed an all-time All-Star team using his system of assigning credit to individual players for the number of wins they had added—relative to the average player—to their teams over the course of their careers. This was Wins Above Replacement, basically. As Palmer remembers it, the magazine didn’t care that he had proven scientifically that Babe Ruth had won his teams an all-time best 124 games above the output of an ordinary player—or that Ted Williams would have surpassed him with 153 or so, had he not lost three years of his career to World War II. The publication spiked the piece, deeming it too complicated for any baseball fan to care about.
Palmer still managed to put his model to good use–until his bookie cut him off when he won five out of five bets, at $50 apiece, on a single day. So he figured out how to outsmart the Massachusetts Lottery Numbers Game instead. His strategy netted him a winner every week, turning a reliable profit. “It worked pretty well,” Palmer recalled. “But after a few months, my numbers stopped coming up. So instead of getting 12 winners, I had none in three months, which is very suspicious, probability-wise.”
Dick Cramer was 29 when he left a job as a chemistry researcher at MIT for one at the pharmaceutical company that would become GlaxoSmithKline. His family more or less treated a PhD as a rite of passage. As a child, he too liked to make lists of things on his mother’s typewriter, and when he got his hands on his first baseball encyclopedia, he made lists out of that. Cramer had a hard time fitting in with his peers. He showed up to his first Halloween party dressed as Cinderella, with grapefruit halves for breasts.
As an undergraduate at Harvard, Cramer narrowly missed out on being in the band with Ted Kaczynski, the Unabomber, who had quit the previous semester. Instead, Cramer wound up befriending someone who had created a rudimentary on-base-plus-slugging statistic.
Cramer liked to play a baseball simulation game with dice, and made player stats cards for it. He wanted to recreate the 1894 season, the highest-scoring campaign in big-league history, but the stats weren’t published anywhere. To his mind, this left him with no choice but to take up residence in the Harvard library basement and compile the numbers he needed by going through every box score in the Boston Globe for every game played that year. When he was done, he kept going into the 20th century. Not all box scores listed walks, so Cramer recreated the play-by-play of every game and deduced the base-on-balls from the other numbers.
Aside from a night in jail for the fines accrued on his unregistered and uninsured motorbike, and a lab that he blew up at MIT when he cut a few corners on an experiment during his graduate work, Cramer progressed smoothly into the career in pharmaceutical research that he had envisioned. When he got there, he had a new toy at his disposal: a computer. As with Palmer, a career that put Cramer in proximity of the first computers—and which would make him a pioneer in a field that developed pharmaceutical drugs with the help of software—was crucial in his turn to baseball analytics. He began simulating baseball seasons when he was done with his work. It was during those hours that Cramer, building upon a Harvard friend’s idea, devised a formula that would concisely enumerate a player’s contribution to his team’s run production—on-base percentage times slugging percentage.
Meanwhile, Palmer returned to Raytheon to work as a subcontractor for the Department of Defense’s Strategic Air Command, a central cog in the American side of the Cold War. Palmer’s job was to man the computer that operated a radar system located on Shemya, a barren island off the coast of Alaska. The Cobra Dane radar monitored the launch of Soviet test missiles shot into the Pacific Ocean from the Kamchatka Peninsula on Russia’s eastern seaboard. Palmer would analyze the data and try to deduce what the Russians were up to.
On his lunch breaks and after work, Palmer used the computer to crunch baseball numbers. Everybody knew what he was doing with such a crucial piece of military hardware. Nobody minded.
Bob Davids had run into an unforeseen issue.
He started an organization to research the things he understood, which were baseball history and baseball statistics—that is, the normal statistics that everybody knew and loved. And now, somehow, his organization had been infiltrated by a pair of mad scientists who declared that everything about the statistics that had been bedrock to Davids’s comprehension of the game was wrong. Worse still, these fanatics wanted to publish their findings, in articles full of numbers and formulas, in the organization’s signature publication, the Baseball Research Journal.
Davids had been a nose gunner aboard Air Force bombers in the Pacific theater during World War II and began writing arcane baseball pieces for The Sporting News when he got home and started working in government. After its founder, J.G. Taylor Spink, died in 1962, the magazine reinvented itself, moving away from its in-the-weeds “Bible of Baseball” coverage. It no longer had space for Davids.
So on his 45th birthday, he sent a letter to some other baseball research fanatics, some two-dozen people in all. He wanted to know if his fellow “statistorians,” as he called them, might want to form an organization devoted to statistical and historical baseball research. On a warm summer weekend in 1971, 16 eccentrics—one was also a charter member of the Antique Doorknob Collectors of America and the owner of 2,000 doorknobs, another was a 15-year-old boy who liked to walk graveyards to find ballplayers’ tombstones—showed up in Cooperstown to form that new club. They called themselves the Society for American Baseball Research, or SABR for short. It was evident to them that theirs would be a “cozy research group” that would surely not swell to more than 50 members. Four days later, The New York Times made note of the new organization. The article contained no mention of statistics.
Pete Palmer didn’t know that Cooperstown was a bearable drive from his home in Massachusetts and so didn’t join SABR until a few weeks later. Dick Cramer learned of it through an ad in The Sporting News in 1972. Before long, they were each pushing Davids to publish their weird research in the organization’s publications.
Davids wasn’t hostile to analytics, although the subject didn’t interest him or really any of the other SABR members besides Palmer and Cramer. But Davids believed that SABR existed to connect like-minded baseball researchers, and he figured that if there were more of these oddballs out there, they ought to have a mechanism to meet. As a compromise, Davids suggested to Cramer that he and Palmer form a new research committee. The ensuing exchange of letters would change baseball, and then every other sport.
Cramer wrote Palmer to announce the birth of the new committee. Palmer wrote back a neatly typed, four-page, single-spaced letter six days later, and then two more pages three days after that. Palmer explained his linear weights model and told Cramer about his database going back to 1871. He wrote of his studies on on-base plus slugging percentage and how it was nearly as accurate—and much simpler—than linear weights.
They kept writing each other letters and discovered that they had taken different routes to the same destination: a formula for projecting how many runs a team will score based on each player’s typical contribution. Palmer had done it by working out what each individual batter contributed to the team and adding them up; Cramer had made a cumulative calculation for an entire team and worked back to the individual player.
Cramer was stunned. “This is a revelation,” he remembers thinking. “This makes sense to me.”
“It was amazing,” Palmer recalls, “that we had more or less reached the same conclusion independently.”
It was clear that Palmer was several years ahead of Cramer. In his memoir, When Big Data Was Small, Cramer would call Palmer “the Newton or the Darwin of sabermetrics” and “its intellectual creator.”
“Yes, there were earlier voices in the wilderness,” Cramer wrote. “But Pete, by combining some of that earlier work with insights of his own, assembled a coherent overview that became the foundation—or at least the departure point—for almost everyone else’s subsequent sabermetric work.”
Palmer already had a habit of exchanging ideas with other sabermetricians in long letters—often typing up 10 pages just to explain to them how and why they were wrong. But connecting with Cramer accelerated the discoveries in their nascent field to warp-speed. They worked separately but exchanged ideas constantly. In each other, they had found the one counterpart who actually understood their thinking. They could test notions that pretty much nobody else could grasp without first studying it for months.
Aside from their politics, which were and still remain as far apart as the spectrum allows—Palmer is a conservative; Cramer a liberal—they had an awful lot in common. They both came to baseball in the same way, gravitating to numbers, making lists and then wondering what they might find if they manipulated those data sets in new ways. They each brought their unquenchable curiosity to bear on the game. They had both been inspired by the same barely noticed research.
Neither of them was a regular at the ballpark, much preferring to think on the game’s problems to watching an actual game; the personalities in baseball and the raw humanity of the game didn’t interest them particularly. They were counterintuitive thinkers, both introverts, both stuck in unhappy marriages. Palmer wondered once if Cramer was on the autism spectrum; the latter suspects he is. They had first-rate educations, although neither man cared all that much about it, and distinguished careers apart from their baseball interest.
In the 1973 issue of the Baseball Research Journal, Palmer published an article titled “On Base Average for Players,” making the case for what is now known as on-base percentage. Between lists of current and all-time OBA leaders, Palmer also noted that "it is important to remember that OBA is only one component of hitting, and that slugging is equally valuable. […] One thing the OBA does is give percentage recognition to the player’s ability to get on via the walk and the [hit by pitch] as well as the hit. He has saved his team an out and he is in a good position to score a run.” That laid the groundwork for future papers.
The 1974 Baseball Research Journal led off with an article with a double byline: “The Batter’s Run Average,” by Dick Cramer and Pete Palmer.
The batter’s run average, or B.R.A., is a new statistic that we devised independently of one another. [...] A player’s B.R.A. is found by multiplying his on-base average (his run-scoring ability) by his slugging percentage (his run-driving-in ability).
They then introduced Runs Contributed and Additional Wins metrics, wherein they converted the BRA into tidy data on how many runs each player had created for his team and, consequently, what share they had in their team’s wins that year. They were forerunners of the modern and fairly ubiquitous Runs Created and Wins Above Average formulas.
On Oct. 15, 1974, Palmer at last sent out a memo to the rest of SABR announcing the grandly named Statistical Analysis Committee. It listed its purpose as a “focus on primarily mathematical research into the relationships among baseball statistics, with long range goals to advocate best interpretations of statistics, particularly in player evaluation, playing strategies, and comparison of different times and leagues.”
Three other SABR members were invited at the start, but only Palmer and Cramer really engaged. That didn’t slow their momentum. After several more paradigm-shifting papers, the coup de grace came in 1977, when Cramer’s seminal article “Do Clutch Hitters Exist?” came out. In it, he scythed down the persistent myth that some hitters consistently performed better with the game on the line:
If clutch hitters really exist, one would certainly expect that a batter who was a clutch hitter in 1969 would tend also to be a clutch hitter in 1970. But if no such tendency exists, then “clutch hitting” must surely be a matter of luck. After all, the only means of ever identifying a clutch hitter would be by his consistency, if not from situation to situation at least from season to season.
Such a test is easily performed, by trying to correlate the residuals [Ed: departures from predicted values] for players in 1969 with residuals for the same players in 1970. Not even a hint of such a correlation exists. […] This means that there is no tendency for players who were clutch hitters in 1969 to be clutch hitters in 1970. True, a few of the “clutch hitters” in 1969 were also “clutch hitters” in 1970; but as many became “unclutch” and most became average, exactly as would be expected if “clutch hitting” is really a matter of luck.
To the few who read and understood it, the article made a deep impression. The notion of clutch is so deeply embedded in the sport that, to this day, Cramer himself has trouble wrapping his head around his own discovery. He admits that when he’s watching baseball, he sometimes forgets to remind himself that there is no special skill there, only a cluster of flattering data.
In those years, Palmer and Cramer, while working intellectually demanding day jobs and tending to their families, compiled an astoundingly influential body of work. They created the now-universal on-base plus slugging percentage metric (which more closely correlates to runs scored than on-base times slugging when weighted for the league average), did studies arguing against the use of the bunt (waste of an out), advocated for runners to almost always round third and go for home with two outs (still likelier to succeed than waiting for someone to drive them in), and showed that the risk of stealing a base outweighed the benefit. Today, these are all consensus beliefs.
In April of 1975, SABR’s Executive Board approved the new Statistical Analysis Committee. While it would grow to a dozen members or so in the following years, it consisted essentially of two people at first: Palmer and Cramer. Soon enough, a third man came along: a 25-year-old from a tiny town in Kansas working menial jobs and feeling somewhat lost after two years of anonymous service to his nation at the tail end of the Vietnam War.
Bill James.
From there, you likely know the story. Building on Palmer and Cramer’s ideas, James wrote his Baseball Abstract annuals on analytics and went from printing them himself to hitting the New York Times bestseller list with them in the 1980s. He coined “sabermetrics” although SABR was still largely heedless of analytics then. Oakland A’s general manager Sandy Alderson became a convert and passed the books on to his protégé and successor, Billy Beane. You might have read about this in Michael Lewis’s Moneyball, which mentions Palmer and Cramer only in passing.
But that pair’s impact runs much deeper. The first true sabermetrician in baseball, Steve Mann, employed briefly by the Houston Astros in 1979, would go to Palmer for his math and probability problems. Craig Wright was the first man to put “sabermetrician” on his business card when the Texas Rangers hired him in 1981. He’d been a high school teacher and a SABR member, a direct intellectual descendent of Palmer and Cramer.
Palmer and Cramer’s analytics lineage extends far past a generation of baseball decision-makers who discovered their work either directly or through James. Daryl Morey, who would transform basketball as general manager of the Houston Rockets, once interned for Cramer.
But for all of their influence, for all the ways that their thinking consolidated earlier work in analytics, organized it into a coherent philosophy, and changed virtually every sport in countless ways, the credit has escaped them. Today, Cramer and Palmer are both retired and living in New England, where they still do research. Aside from being feted every now and again by SABR, which now counts thousands of members and is almost completely devoted to analytics, few people have any clue that their work changed the way we play and watch and talk about sports today. That’s another thing they share in common: neither man cares much about getting the credit for the revolution they set in motion.