
Until Yoán Moncada ruined it with a sacrifice fly in the top of the ninth, every single run scored in the White Sox's first game of their doubleheader against the Royals yesterday was via home run. This was also almost true for the second game of the doubleheader, until Gavin Sheets ruined it with a line-drive double down the left-field line that scored Luis Robert in the top of the eighth. Disgusting. Did Sheets's double plate what was eventually the game-winning run? Yes. Is it, strictly speaking, "fun" to watch and "good" for baseball if every run is scored via homer? Perhaps not!
But I enjoyed it when Josh Harrison hit a homer to put the White Sox up in the first game of the doubleheader. Brady Singer probably didn't, considering that, well, he'd given up a home run, but also that the ball had just stayed fair and just made it over the wall, and the expected batting average on the little guy was .410, which is a pretty sad number for a home run. I love a no-doubter as much as the next person, but home runs that don't really deserve to be home runs are even better because they're weird. Tragic for the pitcher, to be sure—last year, I felt so sadly about Lucas Giolito giving up so many home runs on such low xBA values that I made a graph to validate my feelings—but fun for people who care a lot about Statcast, including Joey Votto.
The league-wide average xBA for homers is lower that you might think. In 2022 so far, the average home run xBA is .699, which is also the lowest value since 2015, when xBA first became a thing. Last year, the average xBA on homers was .741. Considering variations in ballparks, lateral angle, ball spin, and the existence of weather, just to name a few factors, it's not terribly surprising that the average home run xBA, which primarily uses exit speed and launch angle, is nowhere near 1.000. xBA only measures the likelihood of a hit, and, as just one example, your average high fly isn't likely to be a hit at all.
But that still doesn't mean that all home runs should be homers. Let's pay some attention to those that shouldn't.
At risk of stating the obvious, you would expect that hitters who hit a lot of home runs would be power hitters, and thus hit convincing home runs more often; you would also expect that the more home runs are hit, the less the occasional random fluke will effect your average xBA. Aaron Judge has hit 43 home runs and all of them deserved to be homers, with an average xBA of .842. Adam Frazier has hit three home runs and precisely none of them necessarily should have been homers, with an average xBA of .151. Here's the least deserving one, hit against Nathan Eovaldi at, surprise surprise, Fenway:
I could give a rundown of the qualified hitters who have deserved their home runs the most so far, which would include such names as Shohei Ohtani, but that's irrelevant. Here are the qualified hitters with the lowest average xBA on their home runs:
Lowest Average xBA, Hitters (HR — xBA)
143. Adam Frazier (3 — .151)
142. Tony Kemp (4 — .319)
141. Yuli Gurriel (7 — .425)
140. Luis Arráez (6 — .427)
139. Santiago Espinal (7 — .435)
138. José Iglesias (3 — .446)
If you do the same thing for pitchers, you get a different looking spread, for a variety of reasons, but mostly because hitters control the factors that go into xBA way more than a pitcher does and also because the league leader in home runs allowed right now (who qualifies for the Fangraphs leaderboards—Josiah Gray actually leads the league in home runs with 28), José Berríos, has given up 24 total, compared to Judge's league-leading 43. The sample-size child kindly alerts us to the fact that if you're only allowing around 15 home runs total that could theoretically register an xBA value anywhere from .000 to 1.000 (effectively the same as anywhere from 0 to 1,000), the standard error is going to be pretty big. Which is to say that a lot of this just comes down to luck, rather than some discernible pattern in pitching, and you'll get the blotchy no-correlation that you see, even for hitters as well.
The measurement for pitchers also becomes a measurement of sadness. Of how often you give up home runs on batted balls that usually aren't even hits. Of undeserved tragedy. (The last bit sounds better if you read it Shakespearean-ly.)
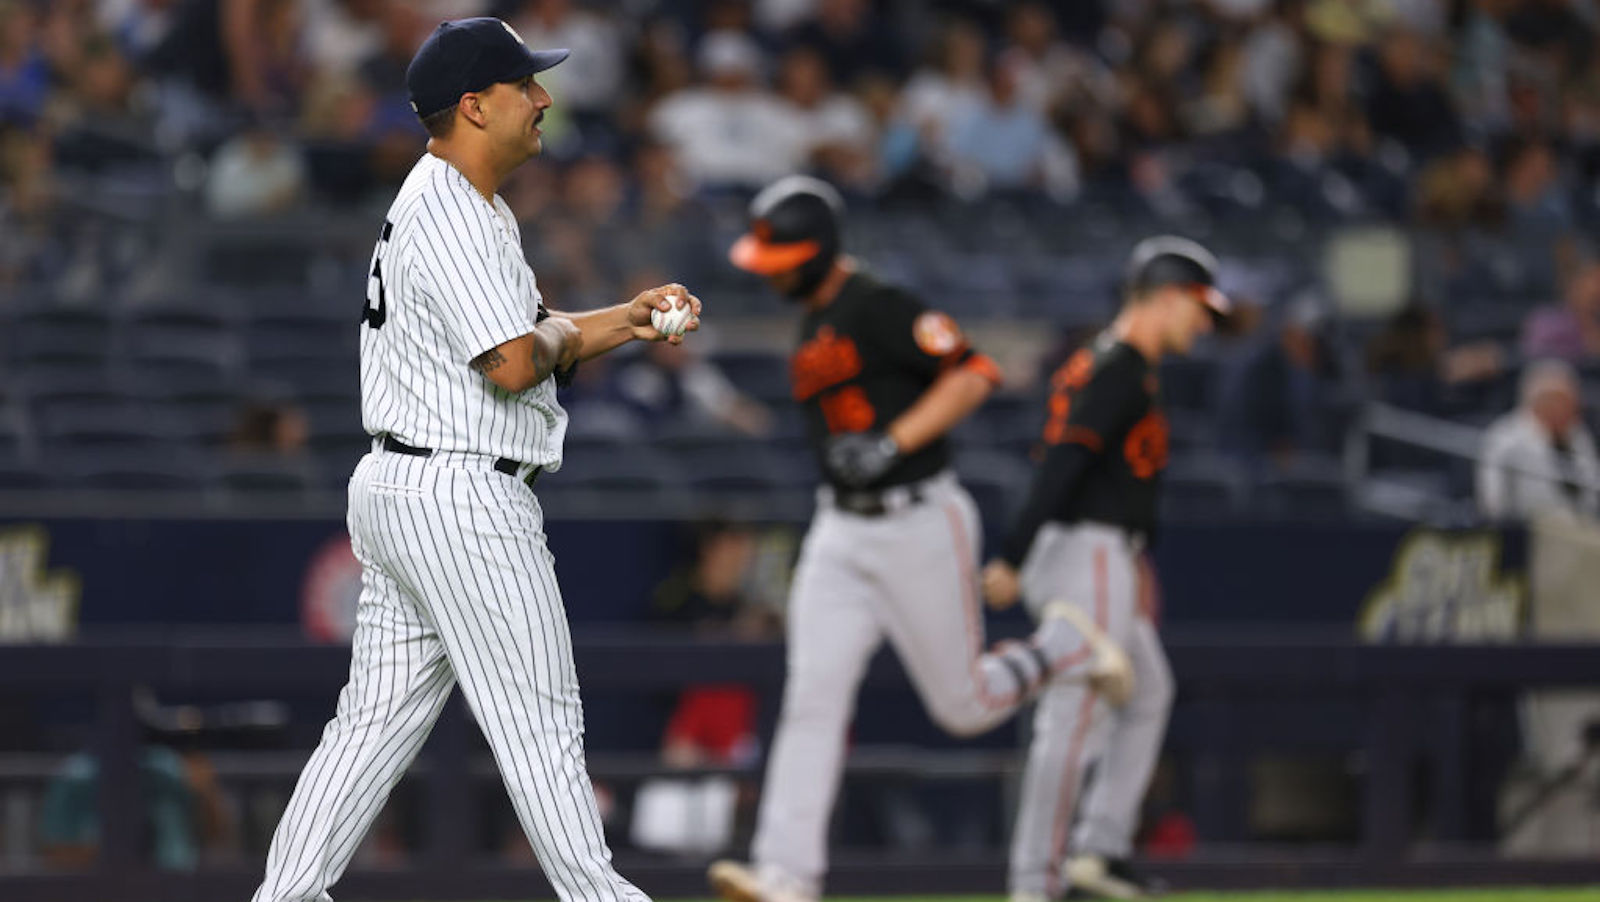
The bottom-right quadrant of the graph is the real sadness quadrant because it's more impressive to consistently give up low-xBA homers, but really the entire bottom half is rather tragic. I have no idea why José Berríos came out looking like an uncanny valley Foolish Baseball pixel art when the other three rendered alright, but at least Robbie Ray's grinning through it down there in the sadness zone—Nestor Cortés Jr. looks appropriately abject, as well he might, with far and away the lowest xBA on home runs for qualified pitchers.
Lowest Average xBA, Pitchers (HR — xBA)
60. Nestor Cortés Jr. (13 — .512)
59. Julio Urías (15 — .594)
58. Luis Garcia (18 — .594)
57. Robbie Ray (21 — .602)
56. Miles Mikolas (15 — .610)
(If you want the data for the unnamed players, you can find batters here and pitchers here.)
When talking about his home run streak, Joey Votto really did describe the charm of how baseball packages its surprises: something happening, somehow, despite the fact that the odds are chalked up against it. Sometimes you hit a weak fly ball and it carries far enough to drop on the other side of the wall. Sometimes you scorch a line drive and it comes up a centimeter short. And sometimes in exploring all of this, you get José Berríos looking like bad pixel art.