
Welcome to the doldrums of the baseball season! Unless you care intensely about the MLB draft and the All-Star Game (or its blatant snubs—cough Dylan Cease), there's really not much going on, which means it's the perfect opportunity to talk about the most important element of baseball: manager challenges. When the little man in the dugout reaches up and cups his ears to signify headphones? That's when I know that I'm watching a real baseball game.
I'll be upfront about this: challenges can only change so much over the course of a 162-game season. The Tigers, the league leader in challenges right now, have challenged 32 plays over the course of 92 games, which is barely one challenge or one play every three games. That's not a lot! Nevertheless, my favorite hobby is caring a great deal about things that matter very little, and it's not like there's much else happening in the league right now, so.
Like many sports things, effective manager challenges are all about how well you implement them and how often you do so. My expectations before cracking open Baseball Reference were that success rates would generally be higher than 50 percent, but nowhere close to 100 percent.
As it turns out, successfully challenging a play, if you look at it in isolation, actually has a slightly worse probability than a coin toss! Here are all of the manager challenge success rates, plotted against the number of total challenges:
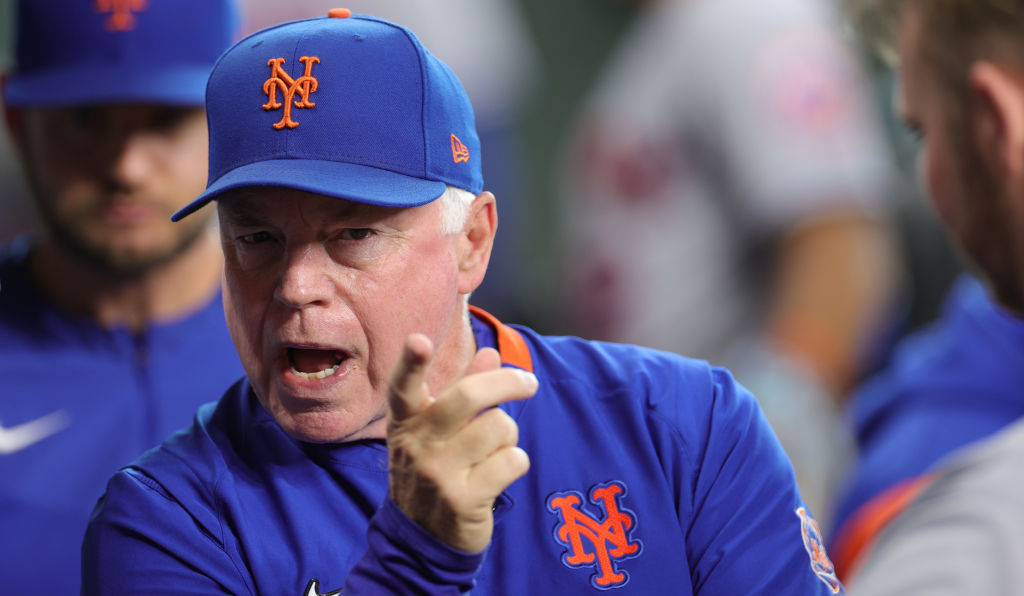
First things first: Holy shit, the Mets. New York teams are really lapping the field here, with the Mets succeeding 78 percent of the time and the Yankees sitting at a nice 69 percent clip, albeit at much lower volume. So kudos to Buck Showalter and, probably more accurately, the Mets' video review team, who have gone into the All-Star break riding a six-challenge success streak. I don't know if that's actually a record or not because, much like when Joe DiMaggio was in the early stages of going for 56, an event that I personally remember, nobody really cared about hit streaks before and so didn't know what the record was. But all caring has to start somewhere, and we may as well start with Buck Showalter.
Much like improbable hit streaks, manager challenges are more complicated than the surface level. The complication in the case of manager challenges: late innings exist.
You often hear commentators talk about "saving" the challenge early on in the game, in case there's a more important play later. After all, it's not just about whether you overturn a call, it's also about how important the call is. The philosophy is mirrored to an extent in coach's challenges overall—40 percent of challenges are used in the seventh inning or later, a fair mark over the 33 percent or so that you'd expect. If you want to dig further, you can look at Leverage Index, or LI, which is essentially a quantification of what people mean when they say "high-leverage situation" as the closer trots out from the bullpen, or "low-leverage situation" as a position player comes up to the mound for the nth time.
Thankfully, Baseball-Reference provides leverage-specific information on each challenge made by any given manager (as an important aside, Joe Maddon's ID is maddojo99, which reads like the Club Penguin log-in someone made when they were 10), so the hypothetical blogger doesn't have to go scrounging through each game's play-by-play.
The average leverage index for challenges is 1.4—higher than the leverage index for neutral situations, which is set at 1.0. Looking at averages by team can get sketchy because the sample-size child starts wailing, especially for teams like the Red Sox or Mariners who barely challenge, but Defector business person and kindred baseball stats guy Sean Kuhn recommended creating a cumulative Leverage Index Above Average statistic—calculating each individual challenge's deviation relative to the sample average of 1.4, and summing up those deviations for each team.
So if a team consistently uses its challenges in high-leverage situations but doesn't use many challenges, then its LIAA value would be smaller than a team that frequently uses its challenges in high-leverage situations and challenges a lot. A team that uses its challenges in low-leverage situations would have a negative LIAA, and so on.
Anyway, here are the teams by LIAA, once you're done yawning and/or saying this is nerd shit:
2022 Team Challenges Rankings by LIAA
1. Colorado Rockies: 13.5
2. Chicago Cubs: 13.1
3. New York Yankees: 9.2
4. Chicago White Sox: 6.9
5. New York Mets: 5.6
. . .
26. Kansas City Royals: -7.1
27. Minnesota Twins: -8.4
28. San Diego Padres: -8.7
29. Toronto Blue Jays: -11.2
30. Texas Rangers: -12.9
Leverage index makes what the Mets are doing arguably more impressive, using their challenges most often in high-leverage situations and still succeeding often. On the other hand, you have the Rangers, who use their challenges in low-leverage situations and fail often.
Beyond that, leverage—and later innings in general—also helps explain why league-wide success rate is just about 50-50. Yes, coaches get things wrong and umpires do too, but no matter how much you might rage at your television about replay reviews, you can imagine that if you locked some video review teams in a black box and fed them plays to decide whether to challenge or not before feeding them to umpires in a separate box, they would successfully overturn a call more than half the time.
The thing about possibly saving your challenges for high-leverage, late-game situations is that you might not get an overturn-able play. Or, even if you're not saving your challenge, one might just not crop up. In that case, if you have a challenge to spare at the end of the game, as teams often do, you might as well pull the trigger even if you don't have much hope. The most obvious example, which also happens to be one of my least favorite baseball things recently, is when managers automatically challenge walk-off plays that aren't even close at home, thus demolishing the tension of the moment and wasting all of our time when the call on the field is inevitably confirmed.
Some teams use late-inning challenges more often than others, and it can reflect in their overall success rates. The Mets only use about 26 percent of their challenges in later innings (compared to the league average of 40 percent), while the White Sox have a neat and tidy 69 percent. Perhaps unsurprisingly, challenges made in the seventh inning or later succeed only 35 percent of the time, while challenges made in innings 1–6 succeed about 59 percent of the time. Not only do you miss 100 percent of the shots you don't take, you also miss many of the shots you do.
What surprised me most out of all of this is how few challenges are made, and how many survive until the later innings. Unless all of that is yellow-bellied manager cowardice, it suggests that—beyond balls and strikes and check swings and the plethora of other unreviewable calls that really get the people going—umpires don't actually make too many mistakes. Maybe that's the main takeaway here, that there isn't actually an issue with umpire quality. And, since I'm already saying things I don't really believe, go Mets. I'm very happy for your success.