
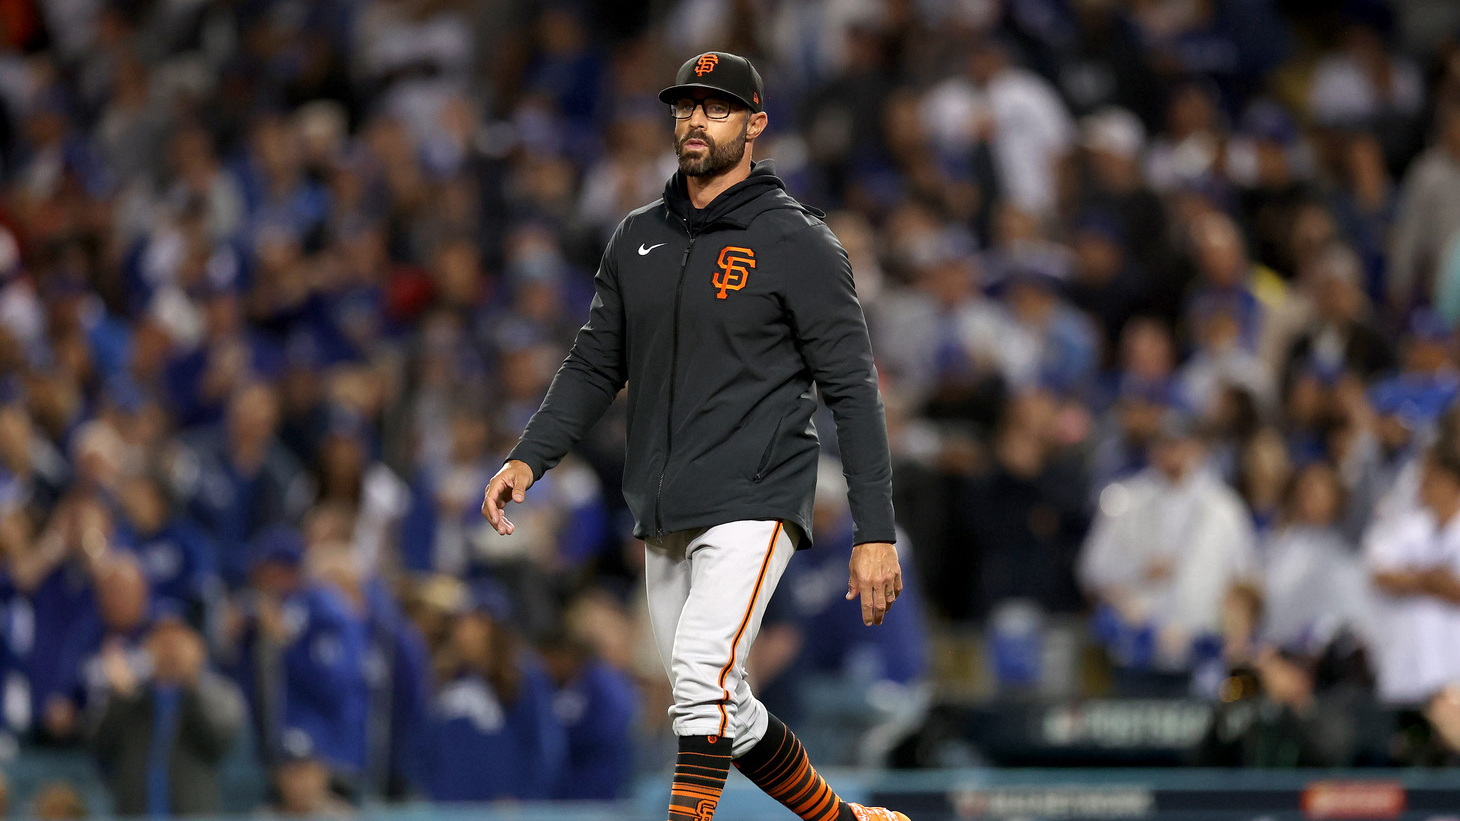
Over the span of the Giants' three-game series against the Phillies, Giants manager Gabe Kapler used a grand total of seven pinch-hitters. That's a rate of 2.33 pinch hitters per game, which seems well and good for a National League series, until you remember that we live in a society with a universal DH. Then you look at Kapler's managerial history with the Giants and you realize that the man is obsessed with pinch hitters.
In 2021, Kapler averaged 2.60 PH/G, the most in MLB, but his PH/G+ (pinch hitters per game adjusted to league average, similar to ERA+ or OPS+) of 137 was second to Bob Melvin's 162, thanks to the NL averaging 1.89 PH/G and the AL averaging only 0.61. That's DH diff right there. The same thing happened in the pandemic environment of 2020, with Kapler leading MLB in PH/G, but coming second to Kevin Cash in PH/G+, as the NL averaged more pinch hitters even with a universal DH. Because the Giants were playing the Phillies this weekend, we may as well continue shanking the carcass of regret and look all the way back at his tenure as Phillies manager, where he posted a meager 107 PH/G+ in 2019 and 105 in 2018.
Clearly, it took a little while for Kapler to hit his stride, but he is steaming into 2022. As of June 1, Kapler is averaging 1.33 PH/G. Considering that the league average is .64 PH/G, his pinch hitter usage yields a PH/G+ of 208. That is over double league average and, to say the least, a lot. If Kapler continues at this pace, he'll be the most pinch-hitter-happy, full-time manager since Bobby Cox with the Toronto Blue Jays in 1982 (we are ignoring 2012, when Sandy Alomar posted a whopping 308 PH/G+ with the Cincinnati Reds in six games coached). In 2022, only Torey Lovullo comes close to Kapler.
Top 5 Manager PH/G Rates in 2022
1. SFG, Gabe Kapler — 1.33 (209 PH/G+)
2. ARI, Torey Lovullo — 1.23 (193)
3. TEX, Chris Woodward — 1.14 (179)
4. CHC, David Ross — 1.00 (157)
5. OAK, Mark Kotsay — 0.87 (136)
Finally, Kapler is the king of pinch-hitting! Of course, the thing strategy-wise about pinch hitters is that they, on average, perform worse than starters. In 2022 so far, non-starting position players are averaging a wOBA of 0.294, below the average starting position player's 0.309 wOBA. In 2021, the gap was even wider.
So if you're using pinch hitters, you would want whatever benefit your pinch hitters bring—platoon advantage, as just one example—to outweigh the disadvantages, like the fact that bench players are usually there because they're either worse than your starters or slightly injured, or you're abruptly throwing a hitter who has yet to see a pitch that day into the game like a raw chicken. In the Giants' recent series against the Phillies, the pinch hitters performed to varying success: Joc Pederson, who entered the game as a pinch hitter and stayed for three at-bats, hit a game-winning three-run homer during Tuesday's 11-inning roller coaster; Evan Longoria struck out looking in the eighth inning of Wednesday's one-run Phillies win. The pinch hitter giveth, and he taketh away.
How do Kapler's pinch hitters normally perform? Glad you asked! Here's league-wide pinch-hitter usage vs. pinch-hitter wOBA:
There's a morass of teams in the middle that I'm not going to disentangle because non-outliers are boring, but the Giants are all the way to the far right of the graph, with pinch hitter performance that's just about average for pinch hitters. Ideally, you'd want to be far up in the upper-right quadrant, though over-usage of pinch hitters in situations where they aren't advantageous will drop their overall performance. It's all about balance. Notably, the Red Sox and Royals pinch hitters are doing well for themselves. Then you have the Washington Nationals pinch hitters, whose position speaks for itself.
As a side note, the best pinch-hitting team in 2021 by wOBA was the Baltimore Orioles. Just as we all expected.
The horizontal league average in the above plot is league average for non-starters, not overall league average. Comparing starter performance to pinch-hitter performance for each team in 2022 gives you this:
Yes, yes, the axes aren't equalized scale-wise despite being the same metric, but it's for good reason. I thought that I should equalize the ticks for better visualization's sake and then ended up with this plot, which I hope at least makes you snort because that’s the only value it has. Anyway, it's a similar story: The horizontal league average in the above plot is, again, league average for non-starters, sample size is a factor, and Nationals pinch hitters have not done well.
Most importantly, the Giants pinch hitters perform worse than their starting counterparts by a not-insignificant amount, even if it's nothing close to the gap for the Mets and Dodgers. This means that Kapler probably shouldn't be using pinch hitters as much as he is, but hey, who's gonna stop him? Definitely not me. Kapler's been chasing this crown for the past three years, and it's high time he earned it. I will be rooting for him to beat Bobby Cox's 1982 record of 218 PH/G+ because that's what he deserves, and so should you.