

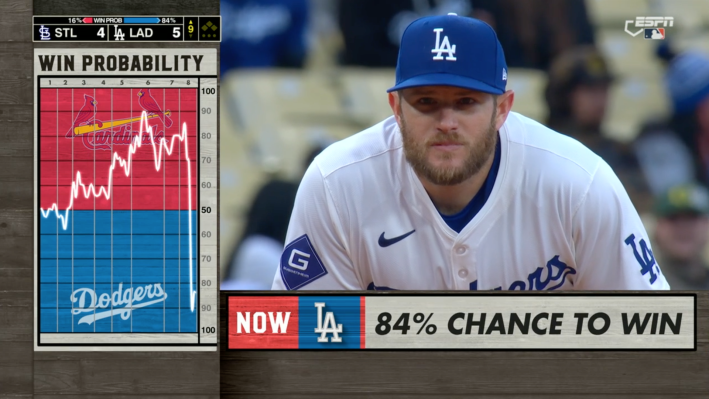
ESPN's new win probability graphic was absent for the first few innings of the Cardinals-Dodgers Sunday Night Baseball game, but popped up in the fourth inning like an untimely zit, noticeable and ineradicable—occupying the space where your eyes normally go when you're trying to look at the score, right where ESPN wants it to be. This is ESPN's next big addition to their broadcasting product: a tug-of-war visualization that quantifies how likely each team is to win the game, and updates live after each play.
Unfortunately, for the regular purposes of a baseball broadcast, ESPN's next big addition is broken. The most obvious defect of the win probability graphic is its redundancy. We already have a win probability graphic, and it's called the score; we have a proprietary win probability generator, and it's called our brains. It does not take a diehard baseball fan to be able to look at the runs scored by Team A, the runs scored by Team B, the innings and outs remaining, and bang the gavel on which team is more likely to win at any given time. What win probability algorithms provide over our human minds is a precise quantification of all of these factors. But to the average person, this precision is irrelevant. Minute differences of percentage points mean nothing unless you're doing an elementary school exercise of slapping an inequality symbol between two values, and the extant features of an out count and diagram of runners on base—bases loaded, nobody out—say far more than, say, 37 percent.
When advanced statistics crop up in sports broadcasts, it's for two primary reasons: to complement the commentators' natural storytelling, and to serve as advertising for the sports league's cloud computing platform. In a win-win situation, the storytelling justifies the advertisement. But the live win probability graphic does no storytelling, because the significance of its probability is contingent on knowing the end result. When Max Muncy came up to bat in the bottom of the eighth inning, the Cardinals up 4-3, the Dodgers were listed as having a 35 percent chance of winning. How do we read this 35 percent chance? It represents the possibility of a comeback, yes, but it also indicates that the Dodgers are not favored to have a comeback. Without the benefit of context, it becomes Schrödinger's win probability percentage: indicative of a comeback and a loss waiting to happen all at once.
Even as the baseball fan is constantly making judgments on how likely her team is to win, her expectations fundamentally do not dovetail with win probability's one-dimensional sequence of percentages. After a Teoscar Hernández home run, a Chris Taylor walk, a Cardinals pitching change, and a stolen second base, the baseball fan believes that the Dodgers are now favored with two outs remaining in the eighth. The actual likelihood of Max Muncy smacking a 420-foot home run to right field is irrelevant—what matters is that she, for a moment, believes it. If the Dodgers score no further runs, that is disappointing and a failure upon them; that this hypothetical end result cleaves to the most probabilistic outcome should change nothing about that disappointment. Then take the opposing Cardinals fan, who is growing increasingly worried as the Dodgers rack up more hits, even as their team is ahead; if the Dodgers were to score no runs, the Cardinals fan would feel relief.
This is not just a quirk of how fans watch baseball, but also why fans watch and care about and have a disconcerting amount of their mental state attributed to the performance of their favorite sports teams. Commentators know how to choose one narrative and feed into it—whichever route they pick, there is a moment of catharsis either way. But as a mere number, Schrödinger's win probability percentage can't select one narrative to suggest, so it suggests every single possibility at once. It serves, "Man, don't get your hopes up for the Dodgers because they aren't favored to win" along with, "It's not over yet! The Dodgers still have a 35 percent chance of winning!" and in doing so, it tries to temper the belief and the disappointment, the worry and the relief, all at once.
When deployed at the correct time, which is after the comeback is over, in the correct form, which is a chart, win probability has its uses. (All win probability graphics, live or retrospective, are pointless for any game that doesn't have some level of comeback or lead swing.) After Max Muncy's home run, ESPN displayed their full win probability chart of the game, and that told a story. It showed that the Cardinals were favored to win, with their probability slowly climbing as the game approached the eighth inning; then, after Max Muncy's two-run homer, it swung sharply in the favor of the Dodgers. The 35 percent probability is beaten into submission by the sheer power of Muncy's bat. There's a comeback story for you; people do so love working up righteous indignation towards numbers. Or, if it better suits your fancy, file off the title of "Cardinals-Dodgers Win Probability" and replace it with "Cardinals' fans' emotional state," and it tells that story, too. In just a couple of seconds, the chart rendered the entire existence of the live win probability graphic pointless.
Of course, there is that second reason why ESPN would embrace advanced statistics: advertising. ESPN has wholeheartedly committed to showcasing Statcast in the past, with graphics inside of the main broadcast and its own Statcast-centered broadcast, colloquially known as the Nerdcast. (ESPN will also be increasing the number of Nerdcast broadcasts this year.) If pressed to name a cloud computing platform, you might surprise yourself—NFL Next-Gen Stats and NHL EDGE both use AWS, Statcast uses Google Cloud, and none of them are quiet about it. Of course, not every Statcast mention is just so MLB can flex its in-house technological innovations or advertise the cloud computing service that it uses. The Nerdcast broadcasts in particular are borne of a serious attempt to provide an alternative view of the game; however, it is still obvious when a Statcast graphic exists just so the commentator can say, "Statcast, powered by Google Cloud."
In the context of ESPN having access to Statcast data and a willingness to implement it, it is notable that the ESPN win probability graphic doesn't use Statcast's pre-existing win probability calculations. In the press conference where Phil Orlins, ESPN's vice president of production, announced the changes ESPN would be making to Sunday Night Baseball, he mentioned that ESPN's win probability algorithm would be created by an in-house analytics team, though one that isn't "necessarily drastically different than the ones that are out there on Baseball Savant or elsewhere." This fact isn't really notable in a vacuum—most win probability algorithms don't differ much from each other, and ESPN is hardly obliged to use Statcast's just because it has access. But when explaining why ESPN was choosing to include a permanent win probability graphic in their broadcast, Orlins gestured towards a change in how people were watching sports. Take one guess as to what that change is.
"I think it just speaks to the way people think about sports right now, the consciousness. It’s on every website," Orlins said. "People who obviously have a wager on the game maybe have a little more thought about it as well."
It's only natural that the win probability graphic is redundant to most baseball fans—ESPN is not catering to them. ESPN is catering to people who are wagering on the outcome of a game, whose primary rooting interest is not for their favorite team to succeed or fail, but for a specific result to occur. For those sorts of viewers, the live graphic is providing a concise, relevant story: the probability, quantified, that they will win or lose their bets.
Perhaps it is cynical to assert that everything is advertising, but this is a sports broadcast we're talking about, where every last inch of space, every spare second, is used to slip in just one bit of promotion: a sponsored replay, a blue-screened advertisement. If the live win probability graphic is not another Google Cloud Statcast graphic slot, then what is it advertising? ESPN recently launched its new sports book, ESPN BET, in partnership with PENN Entertainment. Its MLB schedule already has a column dedicated to ESPN BET's odds for the game, moneylines and over/unders. If the Dodgers fan doesn't have some bet going as Muncy strides up to the plate, that 35 percent provides an easy decision point in case she ever does. If she feels some extraordinary confidence that the Dodgers will win, then ESPN execs would no doubt be delighted if she—whether it's that day or some day in the future—turns that affective response into a bet.
In the most dire scenario, ESPN would eventually replace win probability with live updating odds from its sports book, but that's a step further than it needs to go. It has already begun to target the broadcast toward the most likely customer base for its sports book, rather than the people who watch for the baseball. And what happens to those people? "It will not probably at the outset be mostly positive reaction, but I think over time it will connect with the psyche and intentions of the viewers," Orlins said. At the very gentlest, ESPN hopes that fans will eventually accept the win probability graphic the same way they accepted that the Bally sports bug was never going to change. Orlins, in his accidentally supervillain-esque phrasing, is asking for just a little bit more—not for the broadcast product to move closer to the average viewer, but for the average viewer to change their "psyche and intentions" to align with the broadcast. And we know exactly what type of viewer they're looking for.
Read More:
Stay in touch
Sign up for our free newsletter