

If you watch sports as much as I do, you've no doubt recently been confronted by Some Statistic Powered by AWS. Such insights are everywhere—but why? My knee-jerk reaction to them is often, "Hm! Don't know about that." Not because I am an advanced stats skeptic, but because what I see is rarely what I find useful or entertaining while watching broadcasts, which is, and correct me if I'm wrong here, not what an insight is supposed to be.
AWS is Amazon Web Services, a company that offers products like machine learning tools and cloud storage and servers to customers, including partnerships with various sports leagues. One stated purpose of AWS's partnerships is to enhance fan understanding and engagement in real-time on broadcasts. (AWS also does more on the back end.) The company partnered with Formula One in 2018 and, from then until now, provided resources for car development and, on the fan-facing end, television graphics that range from boiling down driver performance into an abstruse percentage of the car's hypothetical maximum performance to actually compelling corner analysis using drivers' telemetry data to explain which driver was faster around a turn and why. AWS has partnered with a slew of different sports leagues since then, including the Bundesliga, NFL, PGA Tour, and NHL, to much the same end.
Most recently on the NHL front, NHL Edge IQ powered by AWS debuted a face-off probability stat called Face-Off Probability. On the Sportsnet broadcast, the graphic looks like this:

My initial reaction was, I will admit, not terribly kind. On the other hand, neither are my current feelings. Where did the numbers come from? Are they accurate? Why are there three significant figures in the percentage—does the .1 percent really matter? What does this actually do to influence how I view the game? Thanks for telling me that the face-off is pretty much 50-50?
A little bit of research, and the answer to the first question—or something of an answer—crops up:
Priya Ponnapalli, senior manager at Amazon Machine Learning Solutions Lab, said Face-off Probability uses more than 70 different data points, from historic and in-game stats, as well as contextual data. Ponnapalli said the artificial intelligence takes 10 years of faceoff results — more than 200,000 draws for all the players in the league today — and uses data that includes a player's success rate based on faceoff location, home games vs. away games and history against specific opponents. It also factors in personal data such as handedness, height and weight.
ESPN
This helps a bit. A smiley face on a fogged-up windowpane, if you will. But machine learning can be inscrutable by nature—Ben Clemens's very good article in FanGraphs on the similar issue of probabilities shown on Apple TV baseball broadcasts discusses this as well. In sum, what machine learning does is take a set of sample data, or "training data," that has various parameters you think influence the result (in the case of Face-Off Probability, location, home vs. away, etc.), and, different from your bog-standard analysis that works to merely draw a conclusion about the dataset, learns how to predict future results given different values of those same parameters.
It's easy for people to make predictions based on only one factor, such as head-to-head match-up, but add in more variables, and it becomes more complicated to implement and evaluate. You can look at the above quote and say that player weight feels like an unimportant factor in face-off percentage, especially since the players themselves are considered, but an imperfect algorithm might not, or vice versa. Unfortunately, the only way to validate a machine learning algorithm without having it in hand is by looking at how well its predictions actually line up with the results.
A lot of stats out there nowadays are publicly available; that is not the case here. What's left is to manually gather a sample of the predictions where we can find them. Thanks to the nature of branding, a search of "NHL Edge IQ" on the NHL Twitter finds somewhat perplexingly tweeted Face-Off Probability predictions, but only 10. So I decided to manually trawl through the Sportsnet broadcasts of the Oilers and Avalanche series with the play-by-play of each game open in another tab in order to skip to face-offs and look for a Face-Off Probability graphic. The process is time-consuming and my computer started hissing at me approximately a 10th of the way through, but I figured that because there are lots of face-offs in a hockey game, I would find quite a few graphics now that I was looking for them.
I was a fool.
There were two graphics in Game 1, two graphics in Game 2, none in Game 3, and two in Game 4 (at least that I counted, though the graphics are hard to miss because the follow-up slide into "NHL Edge IQ Powered by AWS" lasts a good four seconds longer than the probabilities themselves). That's an average of 1.5 per game, for those scoring at home, which is not a terribly good rate for a self-respecting blogger who enjoys doing things like going outside, so I scrapped my plans to build a corpus that wouldn't receive sample-size accusations by even a toddler. (Everything I did record is here.) Woe is me. Looking at the probabilities will have to wait for another day.
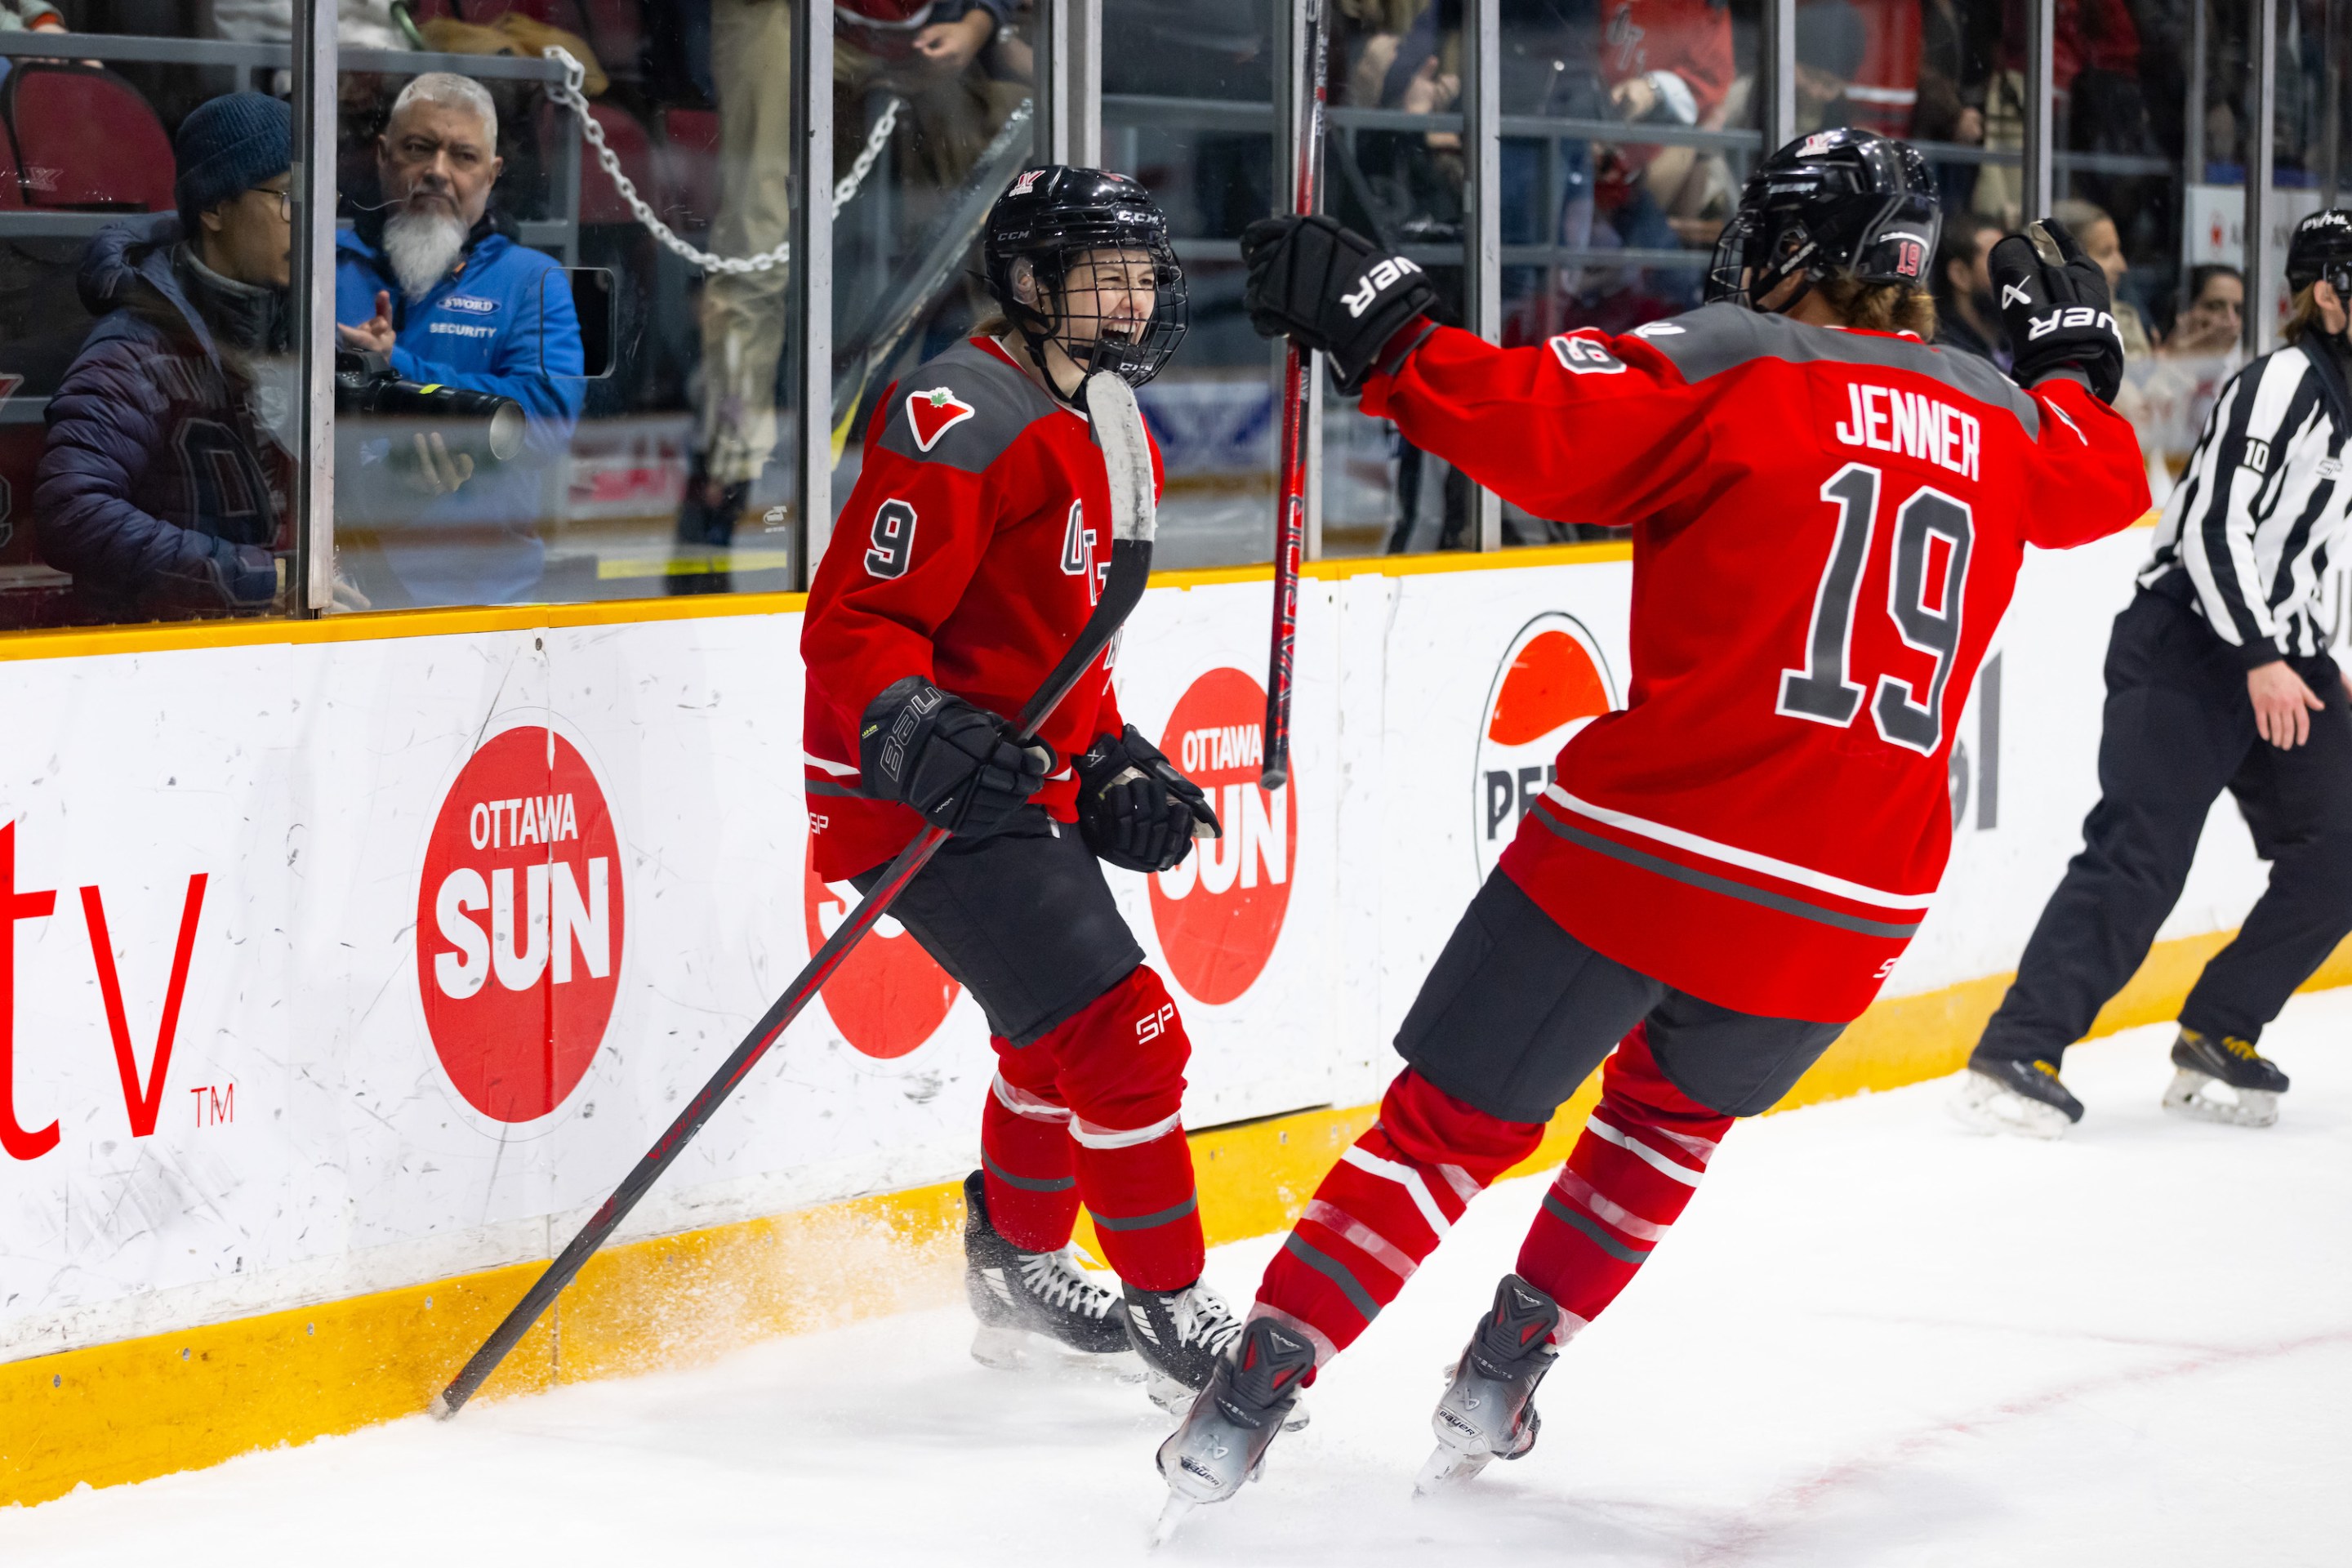
If there's one thing I ultimately scraped from my suffering, though, it's this: The Sportsnet broadcast showed Face-Off Probability values for two nearly identical Leon Draisaitl—Darren Helm face-offs in Games 1 and 2. Both took place on an Edmonton power play late in the second period, in the same location, with the same players on the ice. In Game 1, Draisaitl had a 53.1 percent chance to win the draw. He lost according to the official play-by-play even though the Oilers got possession off the face-off, but who am I to question the scorer's decision? In Game 2, Draisaitl had a 54.9 percent chance to win the draw and lost (possibly again, depending on your view of events).
The gap could be explained by various other factors included by NHL Edge IQ, like the one minute and change of separation or in-game face-off performance, but my broadest takeaway was that I, well, didn't care. Maybe your mileage will very, but I was shown precision down to 0.1 precent on broadcast for a probability that said Draisaitl was slightly more likely to win the face-off but mostly it was a toss-up, and I netted nothing for it. Never mind the correctness of the numbers, this is the biggest flaw of the NHL Edge IQ graphic: seeing the numbers—both that 1.8 percent gap between the face-offs and the raw probabilities—on broadcast doesn't do anything.
Stats don't have to be Important™ to be shown or discussed (just look at the various inanities that I've thrown up onto this site so far), and face-off prediction stats, if accurate, aren't useless (for coaching, or perhaps gambling). But the NHL Twitter and broadcasts make very little use of Face-Off Prediction, partially because the nature of the stat makes it difficult to do so. It's a damned shame because stats, when well-executed, can do what NHL Edge IQ promises: generate tension, understanding, or entertainment by feeding into the story that's unraveling on the screen. Like emphasizing Mookie Betts's May stats whenever he comes up to bat until you figure that something is about to happen, or even more amazingly, nothing will; and knowing the xG value of shot attempts to contextualize how flukey a goal was, or how impressive a save was, or how incredible Jake Oettinger was over the course of a seven-game series; and just seeing a joke about the shortest Shorts in MLB history.
There are great storytellers who use statistics out there, either on broadcast or not; the NHL is currently not one of them. If I don't know what Face-Off Probability adds, the NHL and hockey broadcasters definitely don't. The rallying message surrounding Face-Off Probability seems to be "ignore it" or "face-offs matter," with every single video shown on the NHL Twitter ending in a goal. A generally baffling NHL network segment that confusedly discusses Face-Off Probability lands on the conclusion verbatim. But Face-Off Probability doesn't show that face-offs matter. Face-offs mattering is one of the only reasons why you would care that the stat is thrown up on the broadcast, and the repeated emphasis is like the NHL is trying to reverse-engineer a justification for having purchased a fancy new tool.
That's what the purpose of the stats seem to be, rather than enhance our view of the game. In the case of the Apple TV statistics, no matter how flawed, I could buy that they were at least attempting to inform the way you watched baseball because they cropped up every at-bat. Face-Off Probability—treated proprietarily, used so sparingly and ineffectually, and, if I'm feeling particularly ungenerous, cropping up at similar points each game—instead reads as nothing more than an advertisement for AWS. The percentages are just there to flow in and out of your mind without leaving behind so much as a ripple. It's the logo next to them that's meant to stick. Of course, advertising is the reason why any company partners with sports leagues. We see it all the time: fifth-innings sponsored by your local car dealership, Jim Nantz reciting to you CBS's upcoming primetime schedule. It just sucks to see advanced stats get flattened into the same framework in which they become inutile numbers, a thin excuse for a corporate logo to claim a few more seconds of air time.
Advanced stats are in a golden age right now, both in terms of access and the sheer amount of newly available data. AWS even actually powers some of it. But Face-Off Probability offers a glimpse at what this particular kind of advanced-stats proliferation risks: a celebration of the tool that created the numbers undertaken at the expense of finding any real value within those numbers. That's a tragedy.
Read More:
Stay in touch
Sign up for our free newsletter